𝒞𝒽𝑒𝓃, 𝒥.*, et al. “TOGGLE identifies fate and function process within a single type of mature cell through single-cell transcriptomics.”
Zeng, L., Yang, K., Yu, G. 𝒞𝒽𝑒𝓃, 𝒥.*, et al. Advances in research on immunocyte iron metabolism, ferroptosis, and their regulatory roles in autoimmune and autoinflammatory diseases. Nature - Cell Death Dis 15, 481 (2024). https://doi.org/10.1038/s41419-024-06807-2
Tan, Y., Zhang, Z., Zheng, C., Wintergerst, K. A., Keller, B. B., & 𝒞𝒶𝒾, ℒ*. (2020). Mechanisms of diabetic cardiomyopathy and potential therapeutic strategies: preclinical and clinical evidence. Nature Reviews Cardiology, 17(9), 585-607.
𝒞𝒶𝓇𝓁𝓁 𝒜𝒫*, Arab C, Salatini R, Miles MD, Nystoriak MA, Fulghum KL, Riggs DW, Shirk GA, Theis WS, Talebi N, Bhatnagar A, Conklin DJ (2022). E-cigarettes and their lone constituents induce cardiac arrhythmia and conduction defects in mice. Nature Communications. 13(1):6088.
Wang, X., Chen, X., Zhou, W., Men, H., Bao, T., Sun, Y., … & 𝒞𝒶𝒾, ℒ*. (2022). Ferroptosis is essential for diabetic cardiomyopathy and is prevented by sulforaphane via AMPK/NRF2 pathways. Acta Pharmaceutica Sinica B, 12(2), 708-722.
Wang, J., Song, Y., Elsherif, L., Song, Z., Zhou, G., Prabhu, S. D., … & 𝒞𝒶𝒾, ℒ*. Cardiac metallothionein induction plays the major role in the prevention of diabetic cardiomyopathy by zinc supplementation. Circulation, 113(4), 544-554.
Zhang, C., Tan, Y., Miao, X., Bai, Y., Feng, W., Li, X., & 𝒞𝒶𝒾, ℒ*. Fgf21 Expresses in Diabetic Hearts and Protects from Palmitate-and Diabetes-Induced Cardiac Cell Death In Vitro and In Vivo Via Erk1/2-Dependent P38 Mapk/ampk Signaling Pathways. Circulation
Klionsky, D. J., Abdel-Aziz, A. K., Abdelfatah, S., Abdellatif, M., Abdoli, A., Abel, S., … & Bartek, J. (2021). Guidelines for the use and interpretation of assays for monitoring autophagy. autophagy, 17(1), 1-382.

Biographical Note
Chen's guidance comes from Dr. Alex P. Carll. Another mentor is Dr. Lu Cai, one of the contributors to the standardization of autophagy detection methods, whose research on criteria for identifying diabetes induced apoptosis has been included in numerous clinical guidelines. Jinwen Ge is President of Hunan University of Chinese Medicine, Leader of the National Administration of Traditional Chinese Medicine Key Discipline: Integrated Chinese and Western Clinical Medicine (Cardiovascular and Cerebrovascular Diseases), and is also responsible for the evaluation of Medicine SCI journal classifications in China.
Innovation
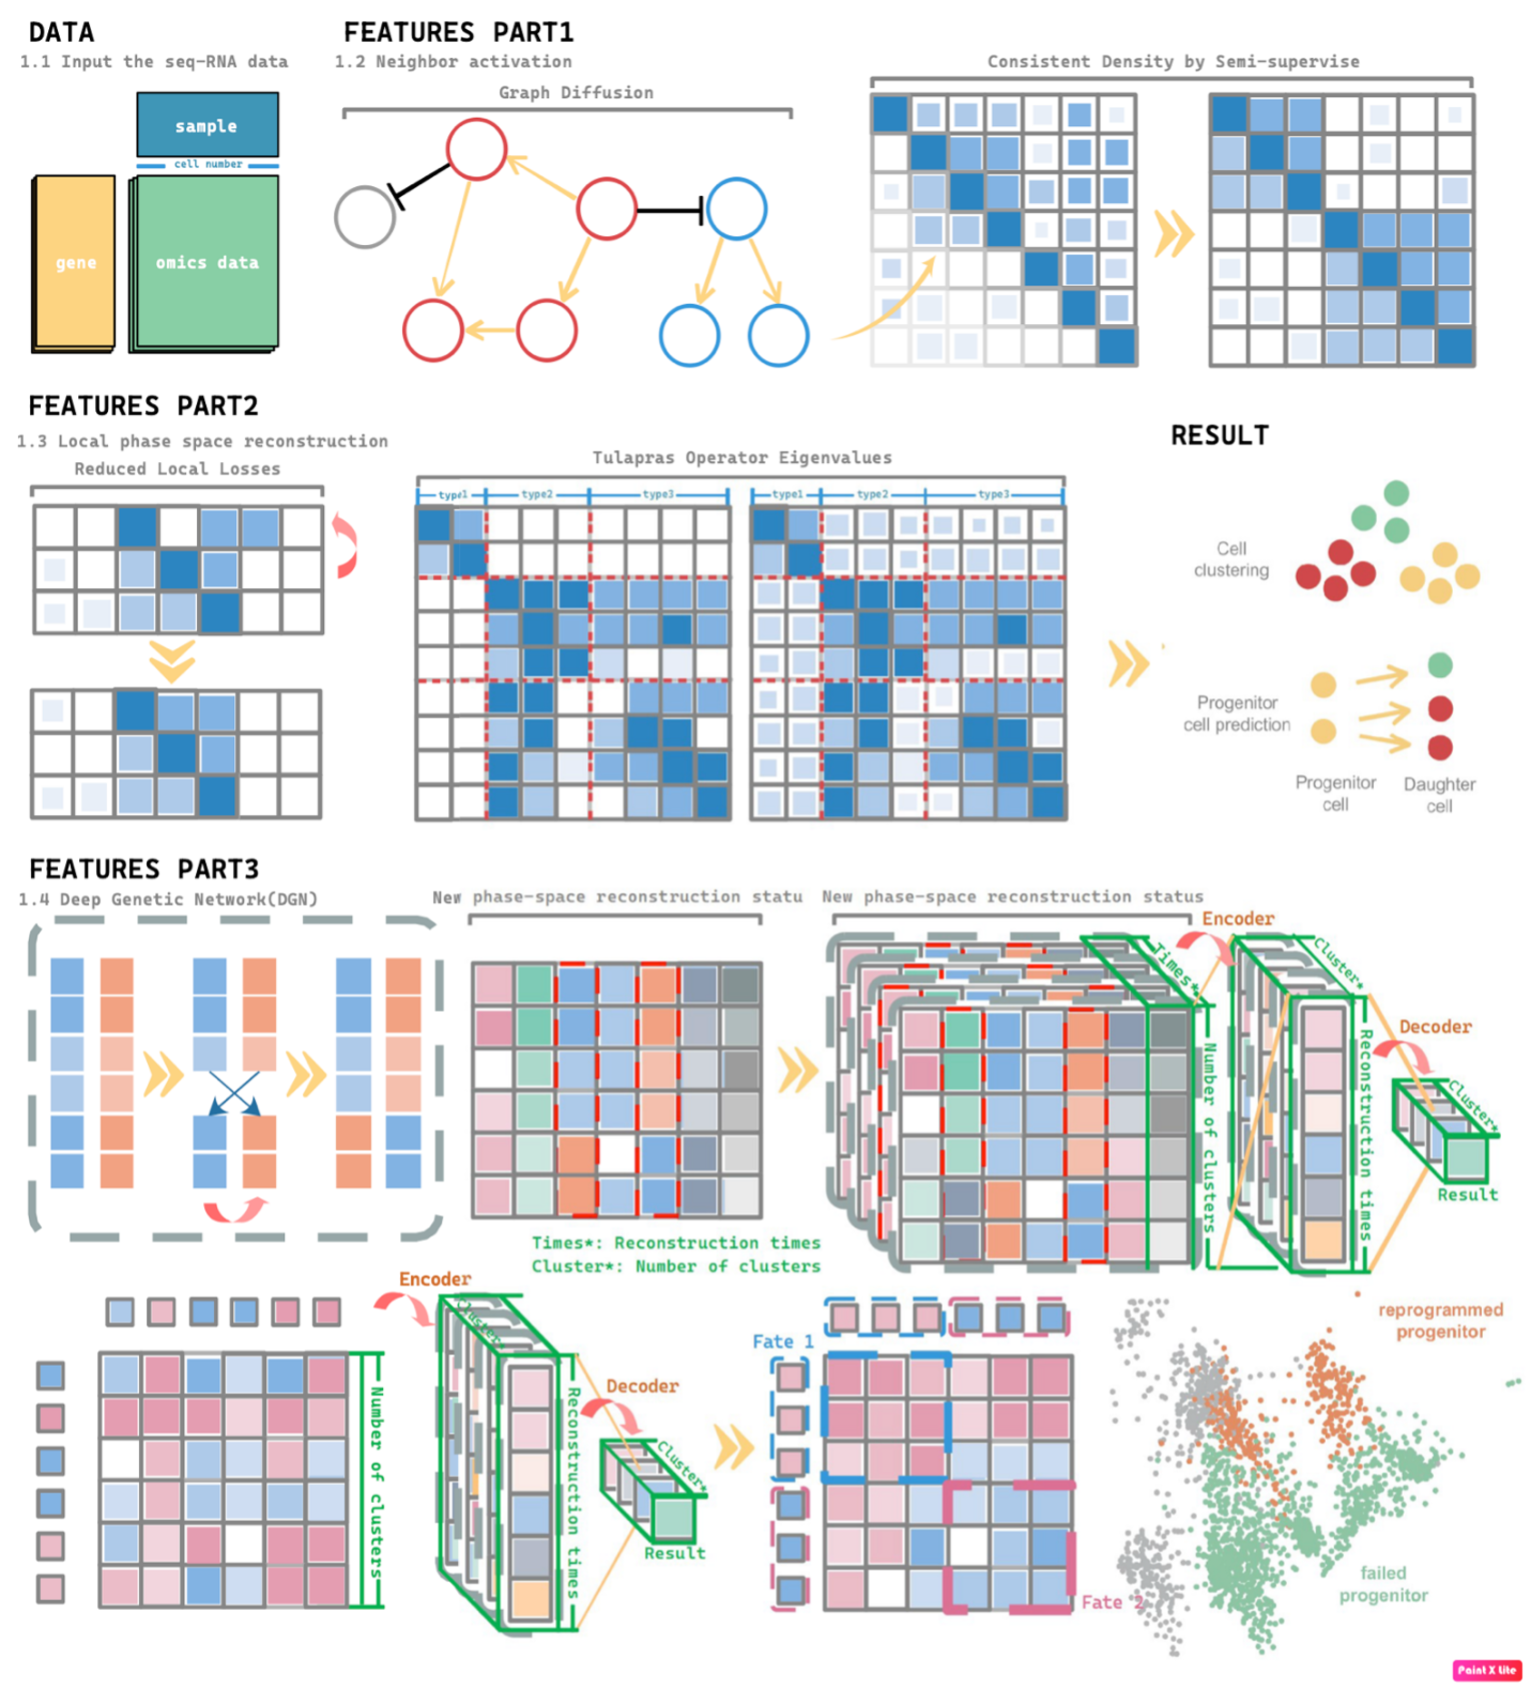
We named this self-supervised learning(a kind of unsupervised learning) method "Trajectory of Gene Generated Lineage Estimation (TOGGLE)." Based on the above issues, this study developed a new algorithm—TOGGLE. Compared with Cospar, Super OT, WOT, and GAN-based OT algorithms, TOGGLE offers the following advantages:
(1) This addresses a novel type of tracing problem. Except for immune cells, mature cells generally do not undergo cloning, making lineage tracing based on cell division unsuitable for mature cells. Mature cells exhibit highly similar temporal states, and their capture is often limited to a single stage within the programmed fate of cells. Based on the ability to perform mature cell subtype/type classification and lineage tracing prediction, we extended functionality to enable classification within the same subtype/type of cells based on their specific functional states.
(2) This method enables the tracing of mature cell fates or functions by constructing the continuous fate progression of mature cells (e.g., neurons) in highly similar datasets and grouping them according to their fate progression, even when clear fate boundaries are absent in the data. While previous techniques can only conduct subtype classification and lineage tracing, we enhanced the resolution of these principles to enable programmed fate differentiation, distinguishing different stages of cell fate.
(3) Unlike previous studies that rely solely on the cells at the starting point of a fate, TOGGLE can reconstruct the entire fate trajectory in complete datasets with unbalanced sample sizes, without requiring pre-identification of progenitor and descendant cells. We demonstrated to detect RNA pathway alterations in the e-cigarette dataset and the ability to classify functional cell interactions in the rat myocardial infarction (MI) model dataset.
(4) A corollary of Takens' theorem is proposed, and the resulting method is termed modal entropy embedding. This represents a novel dynamic reconstruction theory based on chaos phase space reconstruction. Hence, this corollary is named the TOGGLE corollary. This algorithm not only establishes the developmental and differentiation lineage of cells (e.g., hematopoietic stem cells) and the reverse induction lineage of regeneration (e.g., reprogrammed cells), but also constructs the programmed fate lineage of mature cells (e.g., ferroptosis), functional transformations (e.g., cardiac pathway differences induced by e-cigarettes), and functional lineages (e.g., cardiomyocytes) and functional subgroups (e.g., fibroblasts).
(5) An innovative Graph Diffusion Functional Map has been developed, which can significantly reduce noise, thereby more clearly displaying the functional grouping of RNA and enabling the capture of more subtle functional differences in high-dimensional data.

Background
This tool is a further refinement and development of lineage tracing. Lineage tracing refers to reconstructing cellular dynamics during the clonal process by inserting DNA base sequences. Step 1-3: Capture cell samples and insert fragments using DOX technology. Step 4-6: When the cells begin to clone, these fragments are carried along. As the cells differentiate, these fragments are also retained but may acquire some random mutations. This technology enables us to trace and observe cells. However, it is extremely expensive and has a very low success rate in DNA insert and detect. Therefore, using RNA sequencing for cell tracking has become a popular topic.

Due to the randomness of DNA fragment capture, this technology is difficult to apply to cells that have temporarily or permanently lost their differentiation capacity. Furthermore, existing algorithms cannot be used to distinguish the fate of mature cells, as their transcription profiles are too similar, and the accuracy is low even in datasets with clear differentiation boundaries. However, research related to mature cells is emerging and requires tracing technology. For example, ferroptosis may offer new methods for cancer treatment, but its mechanism remains unclear.

Questions
While there are numerous tools available for analyzing scRNA-seq data, few are designed to predict the fate of Mature cells, such as neurons. Current computational methods include Weighted Optimal Transport (WOT)14 and Cospar15. WOT constructs lineage information based on dynamic data trajectories but tends to misidentify similar transition trajectories. Cospar utilizes transition matrix principles to infer state transitions between nodes. However, it is not suitable for multi-stage classifications where correspondences are not unique; it cannot classify static, differentiated cell data, such as Mature cells, nor can it distinguish between different programmed stages within the same cell type. The primary challenges in fate prediction, illustrated in Figure, include:
(1) Endpoint Loss. When using the above tools, information on both the starting point and endpoint of cell fate is required. For instance, it is necessary to have progenitor cells like Granulocyte-Monocyte Progenitors (GMP) that can give rise to progeny clones, and to capture samples of descendant clones such as Neutrophils and Monocytes. However, in certain diseases, it is impossible to obtain samples of cells that have reached their endpoint. For example, in cerebral infarction, neurons that have completed programmed cell death cannot be captured.

(2) Time Loss. The above algorithm requires sampling at different time points in order to piece together the continuous and gradual changes in cells, thereby reconstructing the trajectory of transition states during progenitor cell growth. However, in clinical practice, it is difficult to obtain samples at planned time intervals, such as post-surgical tumor tissues, hematomas after brain hemorrhage, or samples from deceased individuals or aborted embryos. Moreover, ethical constraints limit repeated surgeries on humans to collect samples at different time points. As a result, it becomes impossible to obtain samples at various time points, necessitating an increase in the depth of analysis for samples collected at a single time point. This requires first distinguishing cells at various stages of fate progression with high classification accuracy, followed by using these precise classifications to predict cell fate.

(3) Sample Imbalance. When collecting samples at multiple time points, it is possible to capture the starting point, endpoint, and intermediate processes of cell fate, along with dynamic information about the changes in proportion. At a single time point, it is difficult to balance the number of cells in different stages of fate progression, leading to sparse data and uneven sample distribution. This requires modifying the algorithm’s principles, shifting from multi-time-point state transition construction to reconstructing continuous trajectory information from a single time point.

(4) Lack of Fate Boundaries. There is a distinct fate boundary between progenitor cells and Neutrophil/Monocyte cells, where the different fate directions of progenitor cells determine their transcriptional differences. However, the ferroptosis process is a unidirectional and gradually occurring fate progression without a distinct boundary. This means that cells undergoing ferroptosis are intermixed with healthy cells and cells with different expression levels, making the construction of the fate trajectory more challenging.

Functions
𝑻𝒂𝒔𝒌 1: 𝑳𝒊𝒏𝒆𝒂𝒈𝒆 𝑻𝒓𝒂𝒄𝒊𝒏𝒈
Trace the cell lineage of hematopoietic development and fibroblast reprogramming. A: The ground truth of reprogrammed data from Biddy et al., 201816; B: The clustering result of reprogrammed data; C: The similarity matrix of clustering results of reprogrammed data; D: The TOGGLEss prediction result of reprogrammed data; E: The ground truth of neutrophil progenitor data from Weinreb et al. 20209; F: The clustering result of neutrophil progenitor data; G: The similarity matrix of clustering results of neutrophil progenitor data; H: The TOGGLEss prediction result of neutrophil progenitor data
 𝑻𝒂𝒔𝒌 2: 𝑪𝒉𝒂𝒏𝒈𝒆 𝒐𝒇 𝑹𝑵𝑨 𝑷𝒂𝒕𝒉𝒘𝒂𝒚
Figure 11. The Enrichment Results of Genes in Each Gene Group. A: Biological processes and pathways of Group 2; B: Biological processes and pathways of Group 3; C: Biological processes and pathways of Group 4; D: Biological processes of Group 5. (BP: biological processes; PY: signaling pathways. X-axis is fold enrichment)
 𝑻𝒂𝒔𝒌 3: 𝑭𝒖𝒏𝒄𝒕𝒊𝒐𝒏 𝑫𝒊𝒇𝒇𝒆𝒓𝒆𝒏𝒕𝒊𝒂𝒕𝒊𝒐𝒏 𝒐𝒇 𝑴𝒂𝒕𝒖𝒓𝒆 𝑪𝒆𝒍𝒍𝒔
Analysis results of GSE253768 set. A: Cell types of snRNA-seq; B: Fibroblasts and myofibroblasts were divided into 7 groups after TOGGLE analysis; C: Distribution of 7 cell types in MI and Sham groups; D: Weight/strength diagram of cell communication between fibroblasts and immune cells; E: Bubble diagram of cell communication between fibroblasts and immune cells; F: RNA distribution of fibroblasts in the MI group; G: Mapping MI group bulk RNA-seq data on UMAP of fibroblasts; H: Enrichment results of FibR2-G6 (BP: biological processes; PY: signaling pathways. X-axis is fold enrichment).


 𝑻𝒂𝒔𝒌 4: 𝑭𝒂𝒕𝒆 𝑻𝒓𝒂𝒄𝒊𝒏𝒈 𝒐𝒇 𝑴𝒂𝒕𝒖𝒓𝒆 𝑪𝒆𝒍𝒍𝒔
Ferroptotic Neurons Prediction. A: Cells in previous Groups R2-2 and R2-3 further analyzed by TOGGLEss that divided into 5 groups; B: The proportion of ferroptosis-driving genes in each cell group; C: Log2FC values of highly expressed ferroptosis-driving genes; D: The proportion of cells expressing different ferroptosis-driving genes; E: Top 50 pathways of Group R3-4 and Group R3-5 genes.

𝑻𝒂𝒔𝒌 5: 𝑷𝒓𝒆𝒔𝒔𝒖𝒓𝒆 𝒂𝒏𝒅 𝒏𝒐𝒊𝒔𝒆 𝒕𝒆𝒔𝒕𝒊𝒏𝒈 𝒐𝒇 𝒄𝒆𝒍𝒍𝒔 𝒇𝒐𝒓 𝒕𝒉𝒆 𝒔𝒂𝒎𝒆 𝒕𝒚𝒑𝒆.
a: The real label; b: Our classification result


 𝑻𝒂𝒔𝒌 2: 𝑪𝒉𝒂𝒏𝒈𝒆 𝒐𝒇 𝑹𝑵𝑨 𝑷𝒂𝒕𝒉𝒘𝒂𝒚
 𝑻𝒂𝒔𝒌 3: 𝑭𝒖𝒏𝒄𝒕𝒊𝒐𝒏 𝑫𝒊𝒇𝒇𝒆𝒓𝒆𝒏𝒕𝒊𝒂𝒕𝒊𝒐𝒏 𝒐𝒇 𝑴𝒂𝒕𝒖𝒓𝒆 𝑪𝒆𝒍𝒍𝒔


 𝑻𝒂𝒔𝒌 4: 𝑭𝒂𝒕𝒆 𝑻𝒓𝒂𝒄𝒊𝒏𝒈 𝒐𝒇 𝑴𝒂𝒕𝒖𝒓𝒆 𝑪𝒆𝒍𝒍𝒔

