Lineage Tracing: Reprogramming
Import external libraries.
import numpy as np
import os
import LittleSnowFox as kl
#import matlab.engine
#eng = matlab.engine.start_matlab()

print(kl.__version__)
kl.kl_initialize(0)
parent_directory_origin = kl.kl_settings.parent_directory_origin
print(parent_directory_origin)

current_folder = kl.workcatalogue.choosemode_kl(parent_directory_origin,'Lineage',1)
print(current_folder)
Generate similarity matrix
choosen_sample = "Reprogramming"


h5ad_filename = "reprogramming_1.h5ad"


current_folder_input = current_folder
orig_adata,loading_directory,distance_matrix = kl.preprocessing.kl_dense_matrix(choosen_sample,h5ad_filename,"draw",current_folder_input,3,100,0.1,0.001,True)
#orig_adata,loading_directory,distance_matrix_sparse = kl.preprocessing.kl_dense_matrix_sample(choosen_sample,h5ad_filename,"draw",current_folder_input)


#current_folder_input = current_folder
#loading_directory,distance_matrix = kl.preprocessing.kl_dense_matrix(choosen_sample,h5ad_filename,"draw",current_folder_input)
print(loading_directory)
print(choosen_sample)
Save .csv and .mat
#需要区分dense和sparase
save_list = ["orig_adata.obs['label']","orig_adata.obsm['X_emb']"]

#将要计算的文件保存到/result
merged_csv,result_directory = kl.workcatalogue.kl_save(loading_directory,choosen_sample,distance_matrix,save_list,orig_adata)
The files are saved in [LittleSnowFox's Anaconda installation directory]\database\Tracing_sample\Hematopoiesis\result\ as merged_data.csv and distance_matrix.mat.
Unsupervised learning for only progenitor cells
Run [LittleSnowFox's Anaconda installation directory]\database\Tracing_sample\Hematopoiesis\main_v3_matlab_run_only_prog.m
clear;clc;
%% Parameters


%% Load data  and  Split to compute
%% Load data and Split to compute
MM0 = load('result/distance_matrix.mat');
MM0 = MM0.distance_matrix;

%% 读取要排序的对象
count_=readtable(['result/merged_data.csv']);

%computing

MM0=MM0(contains(count_.Var2,'_prog'),contains(count_.Var2,'_prog'));
count_=count_(contains(count_.Var2,'_prog'),:);

%% 得到边界划分点
[p,splitlist] = binary_corr_sorting(MM0,20,100,5,5);
%[p,splitlist] = binary_corr_sorting(MM0,5,80,5,5);

%% 对划分点去重
[uniqueList, ~, ~] = unique(splitlist, 'stable');

%% 对相似度矩阵排序
MM=MM0(p,p);
split=[];

%% 重排count_result
count_result=count_(p,:);
split_simple=uniqueList;

%% 第一个起始位点置为1
split_simple(1)=1;
split_simple=[split_simple,length(MM0)]

%% 计算均值矩阵
[simple_label,simple_matrix]=sample_computing(count_result,split_simple,MM);

%% 计算acc
[acc]=acc_computing(split_simple,count_result);

%% 给出结果
[predict_result]=predict_computing(count_,simple_label,split_simple);
count_result_out=[count_result,predict_result];
[simple_label_result,simple_matrix_result]=cluster_map(simple_label,simple_matrix);
writetable(count_result_out,"result/Reprogramming_prog.csv");

%% 重排小矩阵
[cluster_map_label,cluster_map_matrix] = genetic_encoder( ...
    simple_label, ...
    simple_matrix, ...
    100, ...% nPop = 50;  % 种群规模大小为30
    1, ...% nPc = 1; % 子代规模的比例0.8
    200, ...% maxIt = 200; % 最大迭代次数
    7 ...% cycletimes = 200; % 循环计算次数
    );


%% 绘图
row_labels = cluster_map_label;
column_labels = cluster_map_label;
% 使用 heatmap 函数并传递相应参数
hh = heatmap(cluster_map_matrix);
hh.YDisplayLabels = row_labels; % 设置行标签
hh.XDisplayLabels = column_labels; % 设置列标签


%% 写入文件


%% 临近法激活
%corr_matrix = relevance_generate(0.00085,3,cluster_map_matrix);
%corr_matrix = relevance_generate(0.00087,3,cluster_map_matrix);
%corr_matrix = relevance_generate(0.00093,3,cluster_map_matrix);
corr_matrix = relevance_generate(0.0011,4,cluster_map_matrix);
hi = heatmap(corr_matrix);
hi.YDisplayLabels = row_labels; % 设置行标签
hi.XDisplayLabels = column_labels; % 设置列标签


%% 编码
encode_result = encoder_corr_matrix(0.0012,0.0009,10,4,cluster_map_matrix);
figure(2)
hj = heatmap(encode_result);
hj.YDisplayLabels = row_labels; % 设置行标签
hj.XDisplayLabels = column_labels; % 设置列标签

%% 解码
figure(3)
[weighting_decode,decode_result] = decoder_corr_matrix(encode_result);
weighting_result = weighting_decode + decode_result;
hk = heatmap(weighting_result);
hk.ColorLimits = [19,20]
hk.YDisplayLabels = row_labels; % 设置行标签
hk.XDisplayLabels = column_labels; % 设置列标签
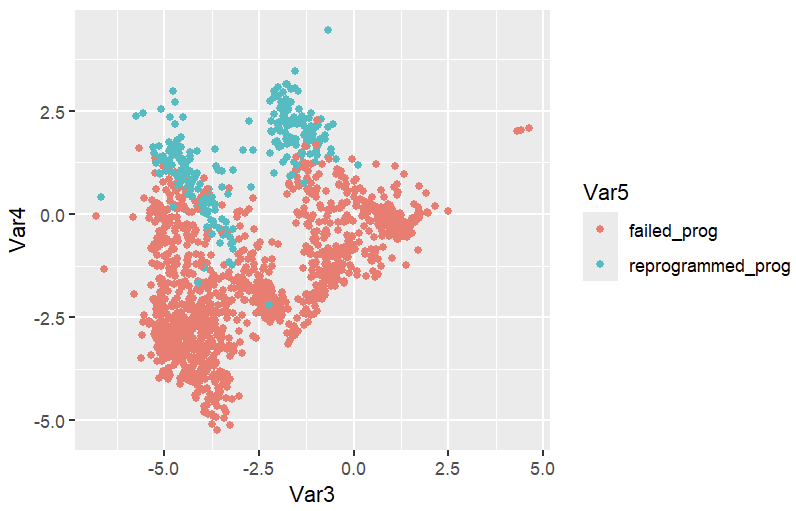
Use .\[LittleSnowFox's Anaconda installation directory]\R_processing\Reprogramming_prog.R to generate the picture.
library(ggplot2)

if (!exists("first_run_flag")) {
  setwd("..")
  current_dir <- getwd()
  print("Switched to the parent directory.")
  current_dir
  first_run_flag <- TRUE
} else {
  print("Not the first run, skipping setwd.")
}

print(current_dir)
database_dir <- file.path(current_dir, "database")
Tracing_dir <- file.path(database_dir, "Tracing_sample")
Reprogramming_dir <- file.path(Tracing_dir, "Reprogramming")
Reprogramming_result_dir <- file.path(Reprogramming_dir, "result")
Reprogramming_map <- file.path(Reprogramming_result_dir, "Reprogramming_prog.csv")

repro <- read.csv(Reprogramming_map)

ggplot(repro,aes(x=Var3,y=Var4,color=Var5))+geom_point()

Unsupervised learning for whole cells
clear;clc;
%% Parameters


%% Load data  and  Split to compute
%% Load data and Split to compute
MM0 = load('result/distance_matrix.mat');
MM0 = MM0.distance_matrix;

%MM0 = load('data/program2k_matrix.mat');

%% 读取要排序的对象
count_=readtable(['result/merged_data.csv']);

%computing

%MM0=MM0(contains(count_.label,'_prog'),contains(count_.label,'_prog'));
%count_=count_(contains(count_.label,'_prog'),:);

%% 得到边界划分点
% [p,splitlist] = binary_corr_sorting(MM0,20,250,5,5);
% [p,splitlist] = binary_corr_sorting(MM0,20,100,5,5);
[p,splitlist] = binary_corr_sorting(MM0,5,100,5,5);

%% 对划分点去重
[uniqueList, ~, ~] = unique(splitlist, 'stable');

%% 对相似度矩阵排序
MM=MM0(p,p);
split=[];

%% 重排count_result
count_result=count_(p,:);
split_simple=uniqueList;

%% 第一个起始位点置为1
split_simple(1)=1;
split_simple=[split_simple,length(MM0)]

%% 计算均值矩阵
[simple_label,simple_matrix]=sample_computing(count_result,split_simple,MM);

%% 计算acc
[acc]=acc_computing(split_simple,count_result);

%% 给出结果
[predict_result]=predict_computing(count_,simple_label,split_simple);
count_result_out=[count_result,predict_result];
[simple_label_result,simple_matrix_result]=cluster_map(simple_label,simple_matrix);
writetable(count_result_out,'result/umap_reprog.csv')

%% 重排小矩阵
[cluster_map_label,cluster_map_matrix] = genetic_encoder( ...
    simple_label, ...
    simple_matrix, ...
    100, ...% nPop = 50;  % 种群规模大小为30
    1, ...% nPc = 1; % 子代规模的比例0.8
    200, ...% maxIt = 200; % 最大迭代次数
    7 ...% cycletimes = 200; % 循环计算次数
    );


%% 绘图
row_labels = cluster_map_label;
column_labels = cluster_map_label;
h = heatmap(cluster_map_matrix);
h.YDisplayLabels = row_labels; % 设置行标签
h.XDisplayLabels = column_labels; % 设置列标签
h.ColorLimits = [0.0007, 0.0008]


%
%
% writecell(simple_label_result,'result/Figure_c_label_blood.csv')
% writematrix(simple_matrix_result,'result/Figure_c_matrix_blood.csv')
% writetable(count_result_out,'result/umap_reprog.csv')


%% 临近法激活
corr_matrix = relevance_generate(0.00069,2,cluster_map_matrix);
hi = heatmap(corr_matrix);
hi.YDisplayLabels = cluster_map_label; % 设置行标签
hi.XDisplayLabels = cluster_map_label; % 设置列标签


%% 编码
encode_result = encoder_corr_matrix(0.00069,0.00071,10,2,cluster_map_matrix);
figure(2)
hj = heatmap(encode_result);
hj.YDisplayLabels = row_labels; % 设置行标签
hj.XDisplayLabels = column_labels; % 设置列标签

%% 解码
figure(3)
[weighting_decode,decode_result] = decoder_corr_matrix(encode_result);
weighting_result = weighting_decode + decode_result;
hk = heatmap(decode_result);
hk.ColorLimits = [15,16]
hk.YDisplayLabels = row_labels; % 设置行标签
hk.XDisplayLabels = column_labels; % 设置列标签
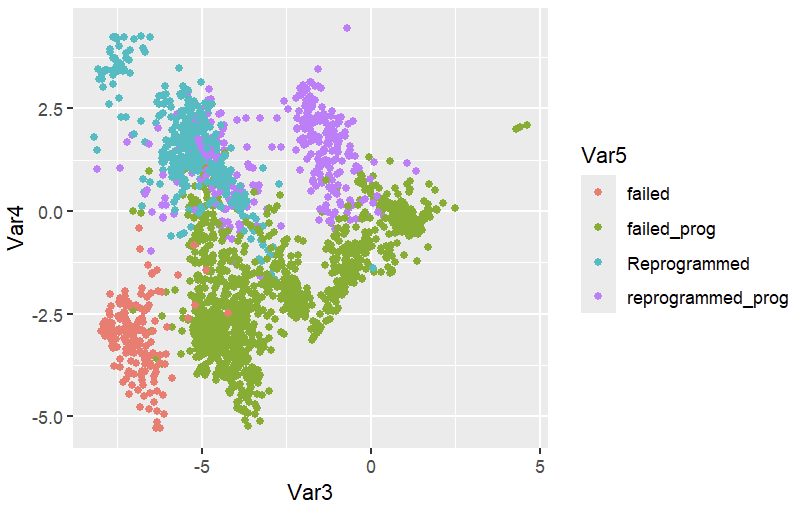
Use .\[LittleSnowFox's Anaconda installation directory]\R_processing\Reprogramming_all.R to generate the picture.
library(ggplot2)

if (!exists("first_run_flag")) {
  setwd("..")
  current_dir <- getwd()
  print("Switched to the parent directory.")
  current_dir
  first_run_flag <- TRUE
} else {
  print("Not the first run, skipping setwd.")
}

print(current_dir)
database_dir <- file.path(current_dir, "database")
Tracing_dir <- file.path(database_dir, "Tracing_sample")
Reprogramming_dir <- file.path(Tracing_dir, "Reprogramming")
Reprogramming_result_dir <- file.path(Reprogramming_dir, "result")
Reprogramming_map <- file.path(Reprogramming_result_dir, "umap_reprog.csv")

repro <- read.csv(Reprogramming_map)

ggplot(repro,aes(x=Var3,y=Var4,color=Var5))+geom_point()

